D3.js中的d3.axis.tickValues()函數用於生成特定值的刻度。此函數返回當前的刻度值,默認為null。
用法:
axis.tickValues([values])
參數:該函數接受以下參數。
- values:此參數用於刻度,而不是使用秤的自動刻度生成器
返回值:此函數返回特定值的刻度。
注意:顯式刻度值優先於axis.tickArguments設置的刻度參數。
以下程序說明了D3.js中的d3.axis.tickValues()函數:
範例1:
<!DOCTYPE html>
<html>
<head>
<title>
D3.js | D3.axis.tickValues() Function
</title>
<script type="text/javascript"
src="https://d3js.org/d3.v4.min.js">
</script>
<style>
svg text {
fill:green;
font:15px sans-serif;
text-anchor:center;
}
</style>
</head>
<body>
<script>
var width = 400, height = 400;
var svg = d3.select("body")
.append("svg")
.attr("width", width)
.attr("height", height);
var xscale = d3.scaleLinear()
.domain([0, 10])
.range([0, width - 60]);
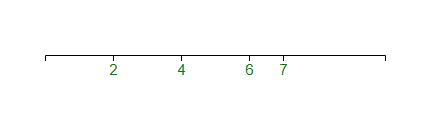
var x_axis = d3.axisBottom(xscale)
.tickValues([2, 4, 6, 7]);
var xAxisTranslate = height / 2;
svg.append("g")
.attr("transform", "translate(50, "
+ xAxisTranslate + ")")
.call(x_axis)
</script>
</body>
</html>輸出:
範例2:
<!DOCTYPE html>
<html>
<head>
<title>
D3.js | D3.axis.tickValues() Function
</title>
<script type="text/javascript"
src="https://d3js.org/d3.v4.min.js">
</script>
<style>
svg text {
fill:green;
font:15px sans-serif;
text-anchor:center;
}
</style>
</head>
<body>
<script>
var width = 400, height = 400;
var svg = d3.select("body")
.append("svg")
.attr("width", width)
.attr("height", height);
var yscale = d3.scaleLinear()
.domain([0, 1])
.range([height - 50, 0]);
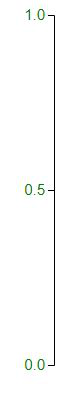
var y_axis = d3.axisLeft()
.scale(yscale).tickValues([ 0, 0.5, 1]);
svg.append("g")
.attr("transform", "translate(100, 20)")
.call(y_axis)
</script>
</body>
</html>輸出:
相關用法
- PHP imagecreatetruecolor()用法及代碼示例
- p5.js year()用法及代碼示例
- d3.js d3.utcTuesdays()用法及代碼示例
- PHP ImagickDraw getTextAlignment()用法及代碼示例
- PHP Ds\Sequence last()用法及代碼示例
- PHP array_udiff_uassoc()用法及代碼示例
- PHP geoip_continent_code_by_name()用法及代碼示例
- d3.js d3.map.set()用法及代碼示例
- PHP GmagickPixel setcolor()用法及代碼示例
- PHP opendir()用法及代碼示例
- PHP cal_to_jd()用法及代碼示例
- d3.js d3.bisectLeft()用法及代碼示例
- PHP stream_get_transports()用法及代碼示例
- PHP Ds\Deque pop()用法及代碼示例
注:本文由純淨天空篩選整理自SHUBHAMSINGH10大神的英文原創作品 D3.js axis.tickValues() Function。非經特殊聲明,原始代碼版權歸原作者所有,本譯文未經允許或授權,請勿轉載或複製。