R 語言中的 3D 繪圖用於添加標題、更改查看方向以及為繪圖添加顏色和陰影。 persp() 函數,用於在透視圖中創建 3D 曲麵。此函數將在 x-y 平麵上繪製曲麵的透視圖。persp()is 定義為泛型函數。此外,它可用於在 3D 繪圖上疊加額外的圖形元素,通過lines()或者points(),使用函數trans3d()。
用法: persp(x, y, z)
參數:此函數接受不同的參數,即 x、y 和 z,其中 x 和 y 是定義沿 x 軸和 y 軸的位置的向量。 z 軸將是矩陣 z 中表麵的高度。
返回值:persp() 返回用於使用齊次 4D 坐標 (x, y, z, t) 將 3D 坐標 (x, y, z) 投影到 2D 平麵的視圖變換矩陣。
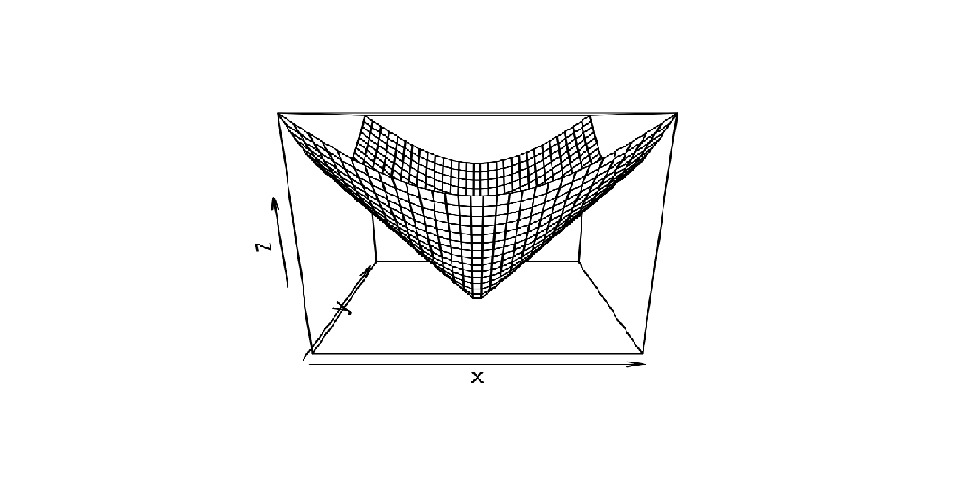
示例 1:簡單的正圓錐
# To illustrate simple right circular cone
cone <- function(x, y){
sqrt(x ^ 2 + y ^ 2)
}

# prepare variables.
x <- y <- seq(-1, 1, length = 30)
z <- outer(x, y, cone)

# plot the 3D surface
persp(x, y, z)
輸出:
- 在上麵的代碼中,函數
seq()生成等距數字的向量。 - 的
outer()函數在 x 和 y 的每個組合上應用函數錐。
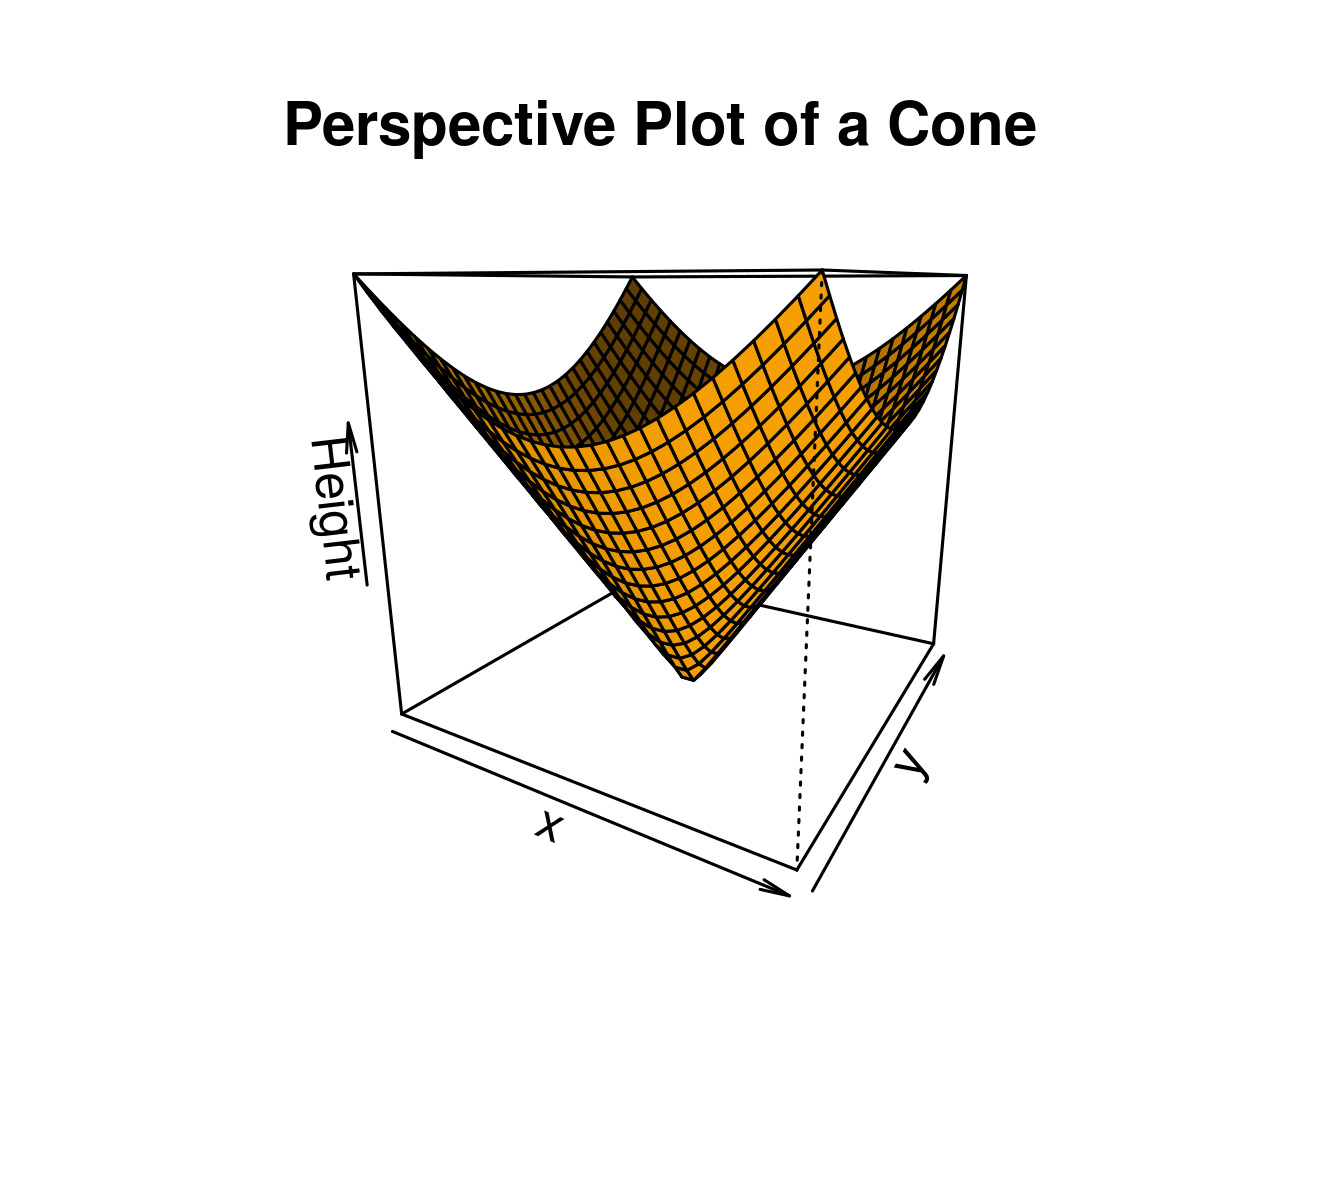
示例 2:向繪圖添加標題和標記軸
# Adding Titles and Labeling Axes to Plot
cone <- function(x, y){
sqrt(x ^ 2 + y ^ 2)
}

# prepare variables.
x <- y <- seq(-1, 1, length = 30)
z <- outer(x, y, cone)

# plot the 3D surface
# Adding Titles and Labeling Axes to Plot
persp(x, y, z,
main="Perspective Plot of a Cone",
zlab = "Height",
theta = 30, phi = 15,
col = "orange", shade = 0.4)
輸出:
- 在上麵的代碼中,可以使用 xlab、ylab 和 zlab 來標記三個軸。
- theta 和 phi 是觀察方向。
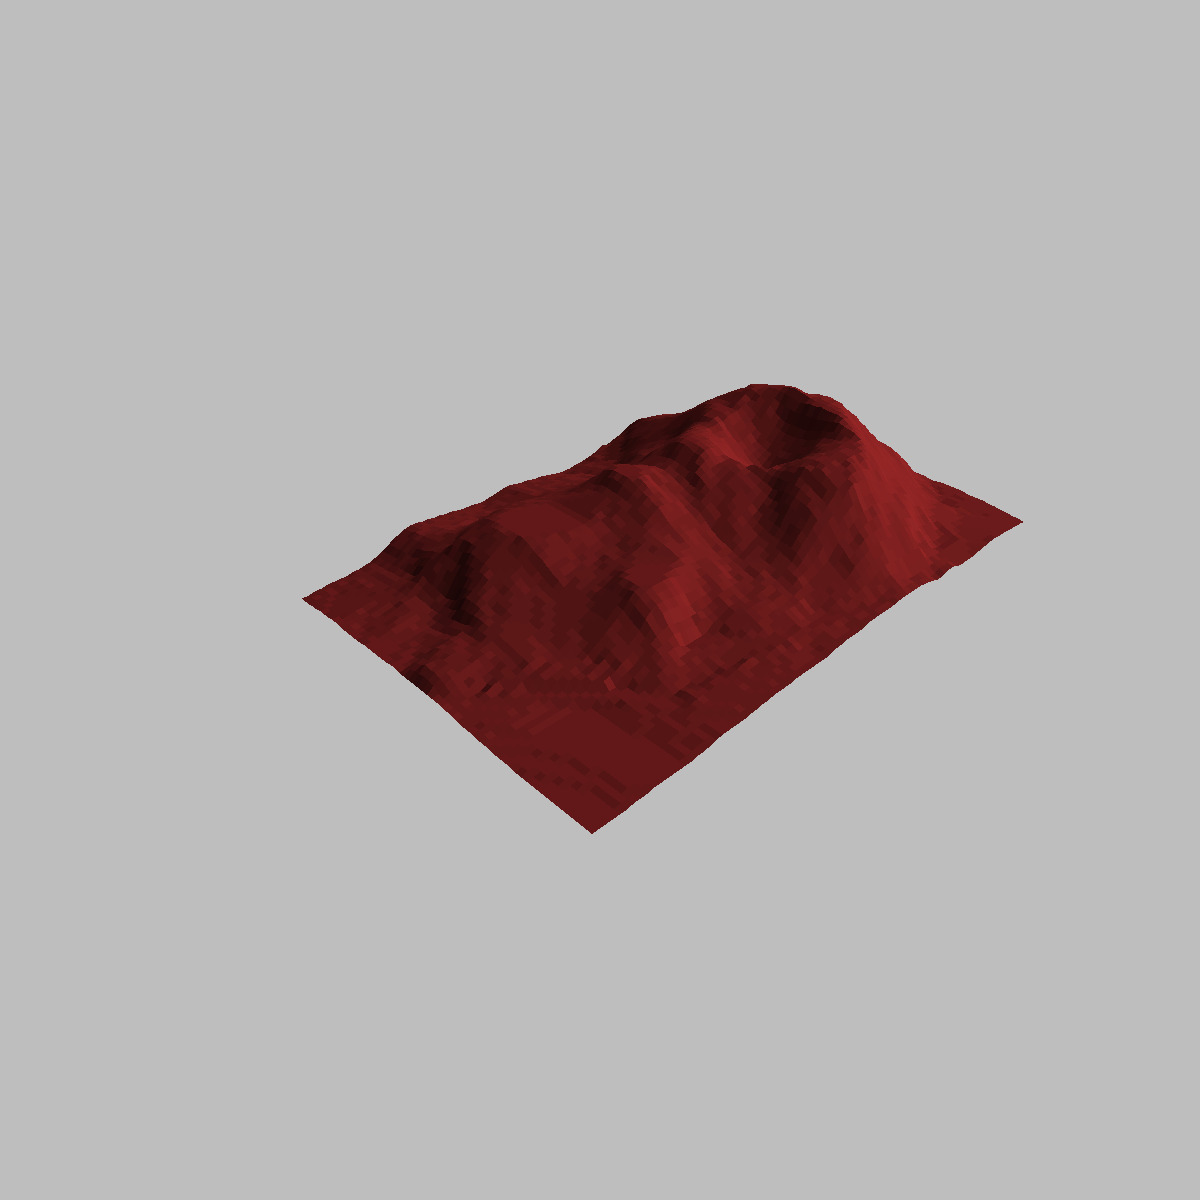
示例 3:可視化一個簡單的 DEM(數字高程模型)
# Visualizing a simple DEM model

z <- 2 * volcano        # Exaggerate the relief
x <- 10 * (1:nrow(z))   # 10 meter spacing (S to N)
y <- 10 * (1:ncol(z))   # 10 meter spacing (E to W)


# Don't draw the grid lines:  border = NA
par(bg = "gray")
persp(x, y, z, theta = 135, phi = 30, col = "brown", scale = FALSE,
      ltheta = -120, shade = 0.75, border = NA, box = FALSE)
輸出:
相關用法
- R語言 plot()用法及代碼示例
- R語言 seq()用法及代碼示例
- R語言 is.primitive()用法及代碼示例
- R語言 dunif()用法及代碼示例
- R語言 lapply()用法及代碼示例
- R語言 optimize()用法及代碼示例
- R語言 lgamma()用法及代碼示例
- R語言 digamma()用法及代碼示例
- R語言 trigamma()用法及代碼示例
- R語言 args()用法及代碼示例
注:本文由純淨天空篩選整理自kaurbal1698大神的英文原創作品 Creating 3D Plots in R Programming – persp() Function。非經特殊聲明,原始代碼版權歸原作者所有,本譯文未經允許或授權,請勿轉載或複製。
