帶狀圖被定義為一維散點圖或點圖,當樣本量較小時用作箱線圖的替代品。它是使用 R 語言中的 stripchart() 函數創建的。
用法:
stripchart(x, data = NULL method, jitter )
參數:
x:要從中生成圖的數據的值。
data:應從中獲取 x 值中的變量的 data.frame。
Method:該方法主要用於分離重合點。
jitter:當使用method = “jitter” 時,jitter 會產生應用的jittering 量。
方法:
- 此示例使用 ToothGrowth 數據庫
- stripchart() 函數是使用 ToothGrowth 數據庫實現的。
數據集:
ToothGrowth$dose <- as.factor(ToothGrowth$dose)

# Print the first 7 rows
head(ToothGrowth, 7)
輸出:
   len supp dose
1  4.2   VC  0.5
2 11.5   VC  0.5
3  7.3   VC  0.5
4  5.8   VC  0.5
5  6.4   VC  0.5
6 10.0   VC  0.5
7 11.2   VC  0.5
以上代碼將打印數據集
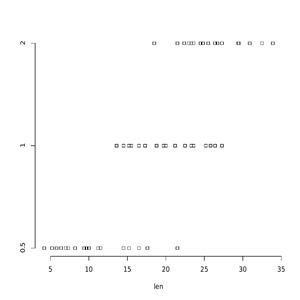
示例 1:簡單的帶狀圖
# Plot len by dose
stripchart(len ~ dose, data = ToothGrowth,
         pch = 22, frame = FALSE)
輸出:
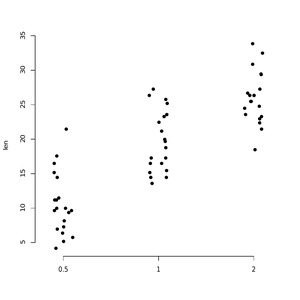
示例 2:繪製垂直帶狀圖
# Vertical plot using method = "jitter"
stripchart(len ~ dose, data = ToothGrowth,
         pch = 16, frame = FALSE, vertical = TRUE,
         method = "jitter")
輸出:
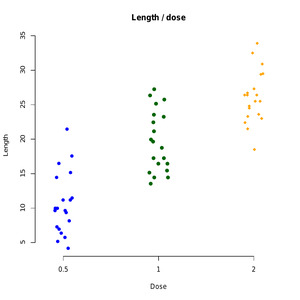
示例 3:按組更改點形狀 (pch) 和顏色
# Change point shapes (pch) and colors by groups
# add main title and axis labels
stripchart(len ~ dose, data = ToothGrowth,
         frame = FALSE, vertical = TRUE,
         method = "jitter", pch = c(16, 19, 18),
         col = c("blue ", "darkgreen", "orange"),
         main = "Length / dose", xlab = "Dose", ylab = "Length")
輸出:
上麵的示例將添加主標題和軸標簽並打印彩色條形圖。
相關用法
- R語言 pairs()用法及代碼示例
- R語言 call()用法及代碼示例
- R語言 strrep()用法及代碼示例
- R語言 expand.grid()用法及代碼示例
- R語言 curve()用法及代碼示例
- R語言 subset()用法及代碼示例
- R語言 quantile()用法及代碼示例
- R語言 table()用法及代碼示例
- R語言 expression()用法及代碼示例
- R語言 runif()用法及代碼示例
- R語言 colorRampPalette()用法及代碼示例
- R語言 heat.colors()用法及代碼示例
- R語言 heatmap()用法及代碼示例
- R語言 dotchart()用法及代碼示例
- R語言 is.primitive()用法及代碼示例
注:本文由純淨天空篩選整理自kaurbal1698大神的英文原創作品 Create One Dimensional Scatterplots in R Programming – stripchart() Function。非經特殊聲明,原始代碼版權歸原作者所有,本譯文未經允許或授權,請勿轉載或複製。


