R 語言中的 title() 函數用於為圖形添加主標題和軸標題。此函數還可用於修改現有標題。
用法:
title(main = NULL, sub = NULL, xlab = NULL, ylab = NULL, …)
參數:
main:圖表的主標題
sub:定義字幕
返回:添加標題後的繪圖
範例1:
# R program to add title to a Graph

# Specifying axis values
x<-1:5; y<-x*x

# Creating a plot
plot(x, y, main = "", xlab = "", ylab = "",
     col.axis = "darkgreen")

# Calling title() function
title(main = "Graph ", sub = "Geeksforgeeks article",
      xlab = "X axis", ylab = "Y axis",
      cex.main = 4,   font.main = 3, col.main = "darkgreen",
      cex.sub = 2, font.sub = 3, col.sub = "darkgreen",
      col.lab ="black"
      )
輸出:
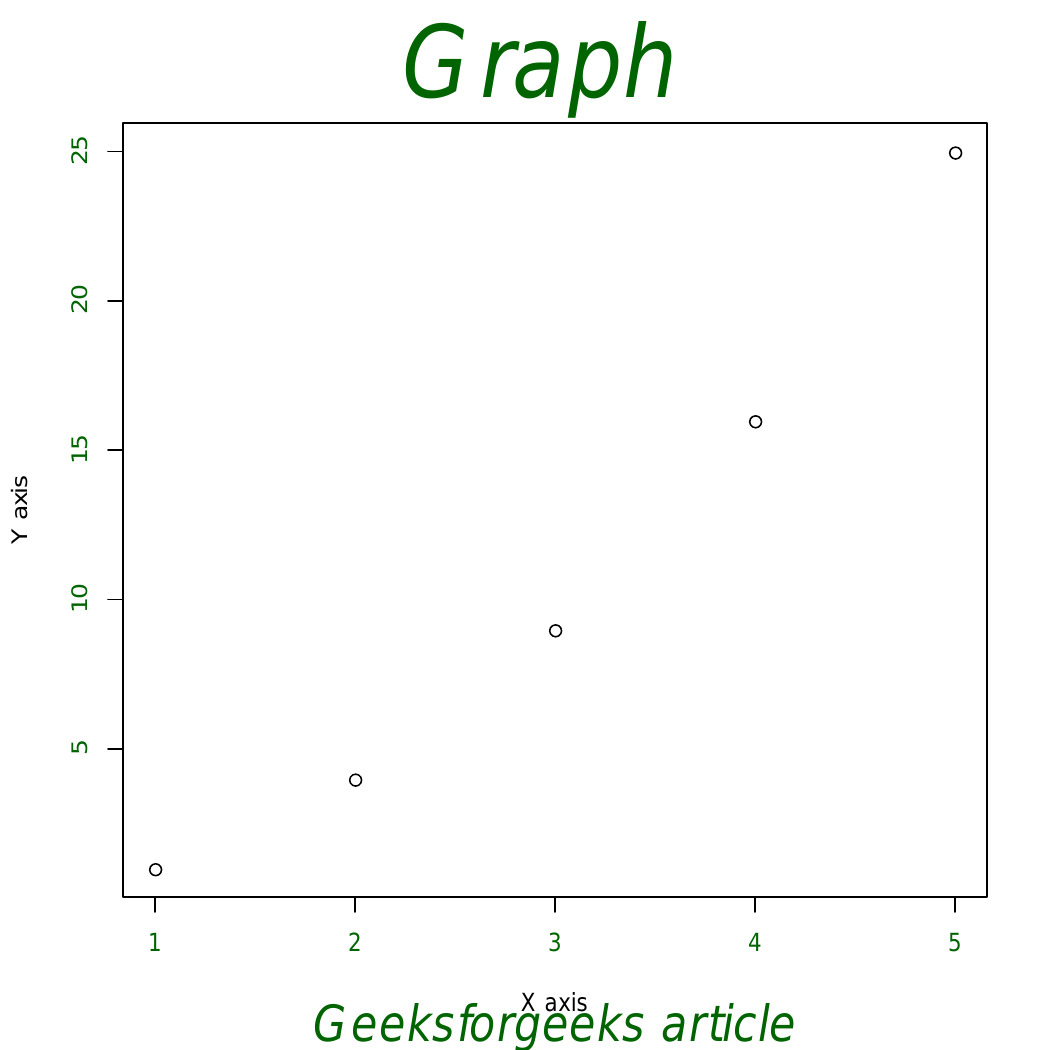
在上麵的例子中,主標題和副標題被添加到情節中。可用於更改字體大小的參數如下:
- cex.main:主標題的大小
- cex.lab:軸標題的文本大小
- cex.sub:sub-title 的文字大小
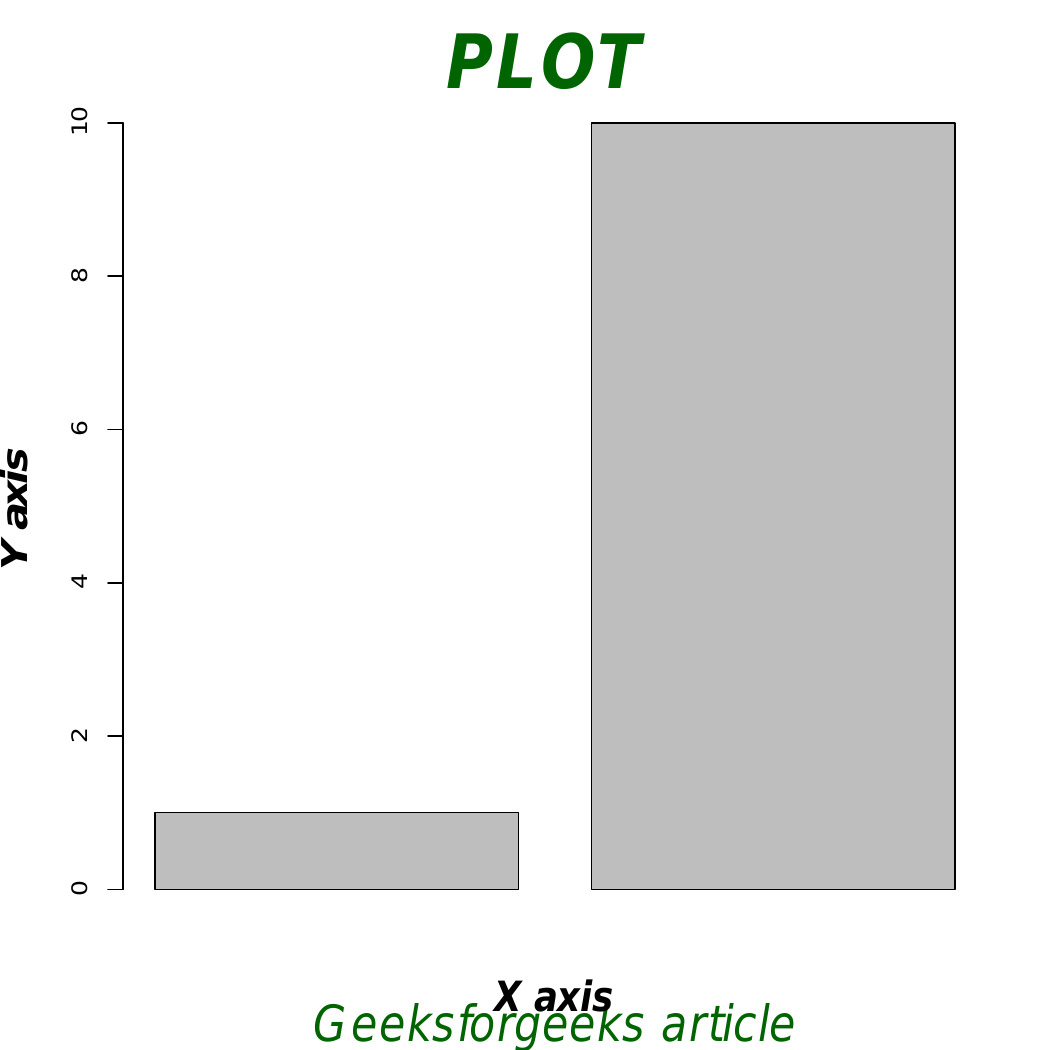
範例2:
barplot(c(1, 10) )
title(main = "PLOT ", sub = "Geeksforgeeks article",
      xlab = "X axis", ylab = "Y axis",

  # Change the colors
  col.main="darkgreen", col.lab="black", col.sub="darkgreen",

  # Titles in italic and bold
  font.main = 4, font.lab = 4, font.sub = 3,

  # Change font size
  cex.main = 3, cex.lab = 1.7, cex.sub = 2
  )
輸出:
相關用法
- R語言 arrows()用法及代碼示例
- R語言 dgeom()用法及代碼示例
- R語言 mutate()用法及代碼示例
- R語言 is.primitive()用法及代碼示例
- R語言 dunif()用法及代碼示例
- R語言 lapply()用法及代碼示例
- R語言 optimize()用法及代碼示例
- R語言 lgamma()用法及代碼示例
- R語言 digamma()用法及代碼示例
- R語言 trigamma()用法及代碼示例
- R語言 args()用法及代碼示例
- R語言 rapply()用法及代碼示例
- R語言 tapply()用法及代碼示例
- R語言 sapply()用法及代碼示例
注:本文由純淨天空篩選整理自kaurbal1698大神的英文原創作品 Add Titles to a Graph in R Programming – title() Function。非經特殊聲明,原始代碼版權歸原作者所有,本譯文未經允許或授權,請勿轉載或複製。